Last Update: December 21, 2020
Portfolio performance metrics consist of portfolio expected or realized risk premium by unit of risk.
This topic is part of Investment Portfolio Analysis with Excel course. Feel free to take a look at Course Curriculum.
This tutorial has an educational and informational purpose and doesn’t constitute any type of trading or investment advice. All content, including spreadsheet calculations and data, is presented for personal educational use exclusively and with no guarantee of exactness of completeness. Past performance doesn’t guarantee future results. Please read full Disclaimer.
An example of portfolio performance metrics is Sharpe ratio [1] which consists of portfolio expected or realized risk premium by unit of risk.
1. Formula notation.
1.1. Ex-ante or expected Sharpe ratio formula notation.
Where = ex-ante or expected portfolio returns Sharpe ratio,
= ex-ante or expected portfolio returns risk premium,
= ex-ante or expected portfolio returns risk premium standard deviation,
= risk free or benchmark returns can be used.
1.2. Ex-post or realized Sharpe ratio formula notation.
Where = ex-post or realized portfolio returns Sharpe ratio,
= ex-post or realized portfolio returns risk premium,
= ex-post or realized portfolio returns mean,
= ex-post or realized risk free returns mean,
= ex-post or realized portfolio returns risk premium standard deviation,
= risk free or benchmark returns can be used.
1.3. Ex-post or realized Sharpe ratio risk free or benchmark returns through time period assumptions formulas notation.
Where = ex-post or realized risk free return through time period,
= number of observations in time period,
= constant,
= ex-post or realized portfolio returns Sharpe ratio,
= ex-post or realized portfolio returns risk premium,
= ex-post or realized portfolio returns mean,
= ex-post or realized risk free returns mean,
= ex-post or realized portfolio returns risk premium standard deviation,
= ex-post or realized risk free return,
= ex-post or realized portfolio returns standard deviation,
= risk free or benchmark returns can be used.
2. Excel example.
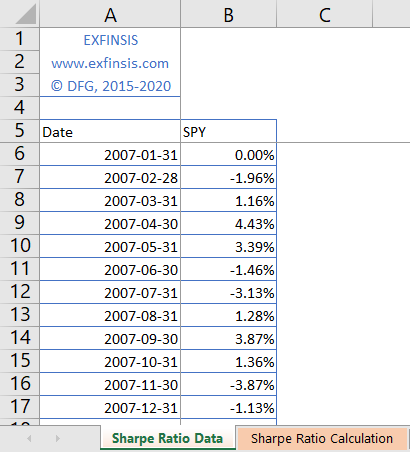
2.1. Sharpe ratio performance metric data.
- Data: S&P 500® index replicating ETF (ticker symbol: SPY) adjusted close prices monthly arithmetic returns (2007-2016).
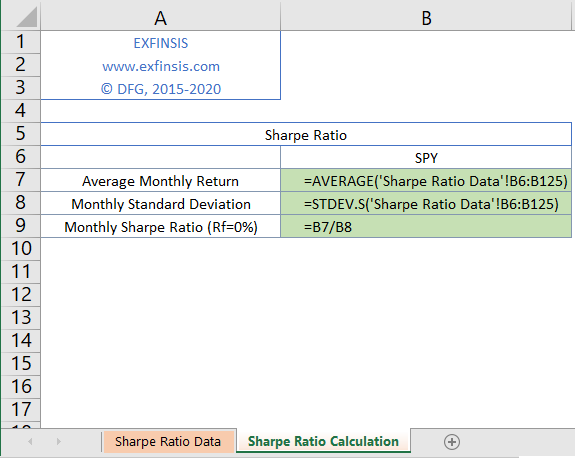
2.2. Sharpe ratio performance metric calculation.
- Note: ex-post or realized Sharpe ratio calculation and risk-free return assumption not fixed and only included for educational purposes.

2.3. Sharpe ratio performance metric calculation formulas.
3. References.
[1] William F. Sharpe. “The Sharpe Ratio”. Journal of Portfolio Management. 1994.