Last Update: February 21, 2020
Stock technical indicators are calculated by applying certain formula to stock prices and volume data. They are used to alert on the need to study stock price action with greater detail, confirm other technical indicators’ signals or predict future stock prices direction.
This topic is part of Stock Technical Analysis with Excel course. Feel free to take a look at Course Curriculum.
This tutorial has an educational and informational purpose and doesn’t constitute any type of trading or investment advice. All content, including spreadsheet calculations and data, is presented for personal educational use exclusively and with no guarantee of exactness of completeness. Past performance doesn’t guarantee future results. Please read full Disclaimer.
An example of stock technical indicators is commodity channel index CCI [1] which consists of bounded oscillator that measures a stock price variation from its statistical mean. Twenty days and constant factor are commonly used to make sure most values fall within bands.
1. Technical indicator calculation.
1.1. Typical price calculation.
Where = current period stock typical price,
= current period stock high price,
= current period stock low price,
= current period stock close price.
1.2. Typical prices smoothing calculation.
Where = current period stock typical prices twenty days simple moving average,
= current period stock typical price.
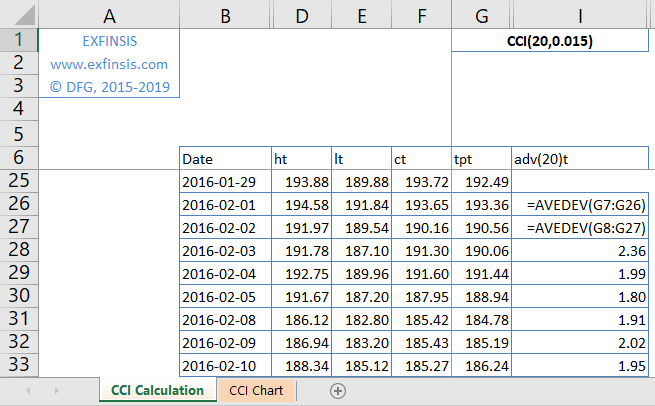
1.3. Typical prices mean absolute deviation or average deviation calculation.
Where = current period stock typical prices twenty days mean absolute deviation or average deviation,
= current period stock typical price,
= current period stock typical prices twenty days rolling arithmetic mean.
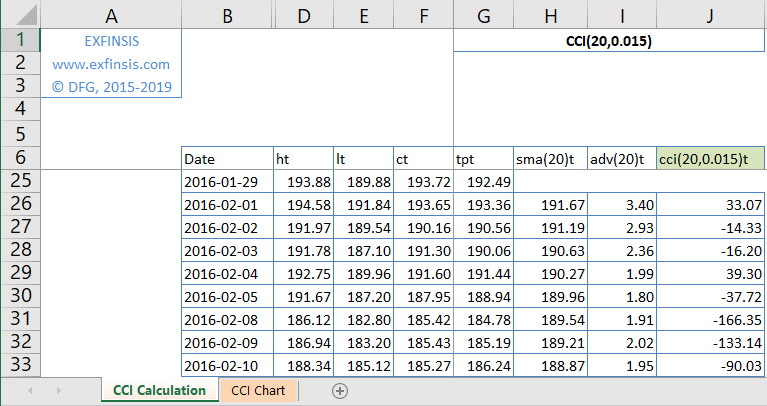
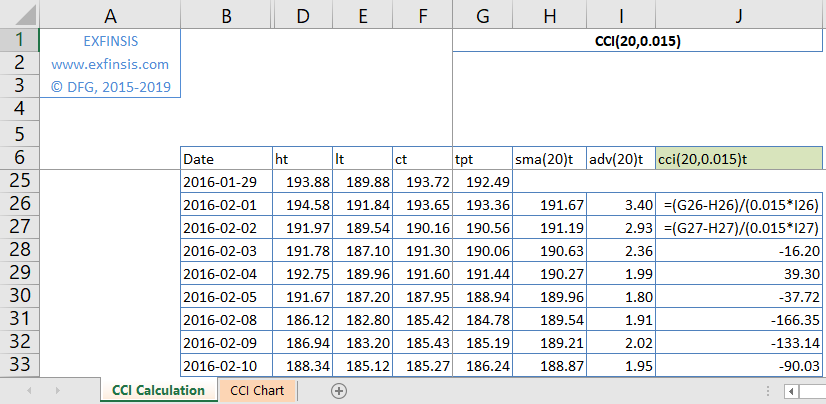
1.4. Commodity channel index calculation.
Where = current period stock typical prices twenty days and constant factor commodity channel index,
= current period stock typical price,
= current period stock typical prices twenty days simple moving average,
= current period stock typical prices twenty days mean absolute deviation or average deviation,
= constant factor.
2. Excel example.
2.1. Typical price calculation.
- Data: S&P 500® index replicating ETF (ticker symbol: SPY) daily high, low, close prices (2016).
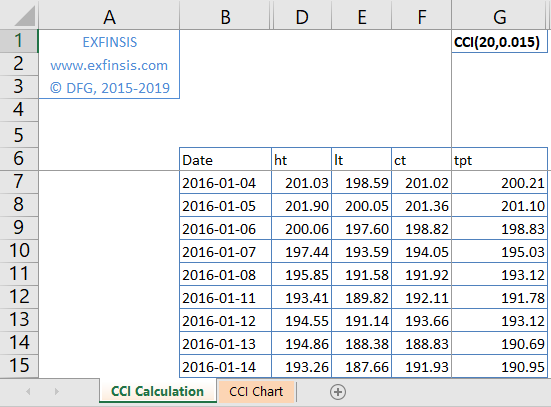
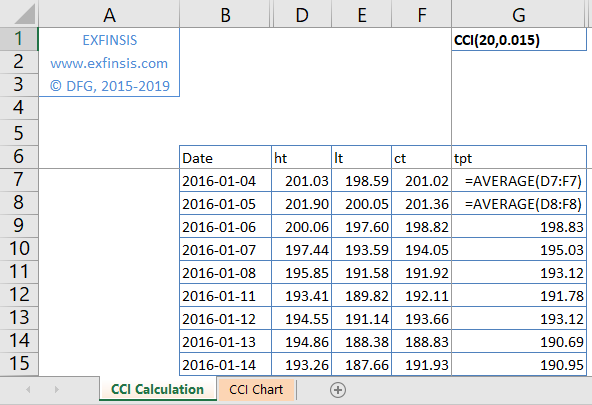
2.2. Typical price calculation formulas.
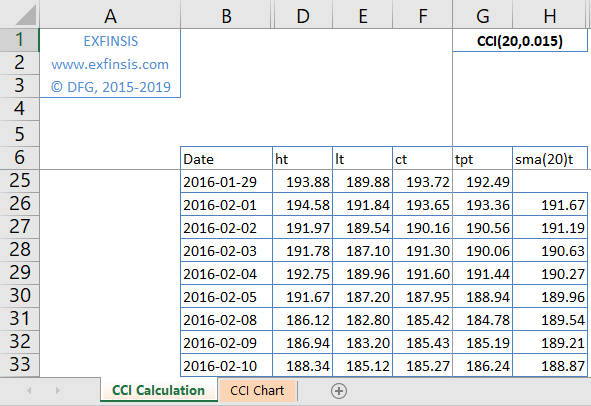
2.3. Typical prices smoothing calculation.
- Data: S&P 500® index replicating ETF (ticker symbol: SPY) daily high, low, close prices (2016).
- Typical prices smoothing number of periods not fixed and only included for educational purposes.
2.4. Typical prices smoothing calculation formulas.

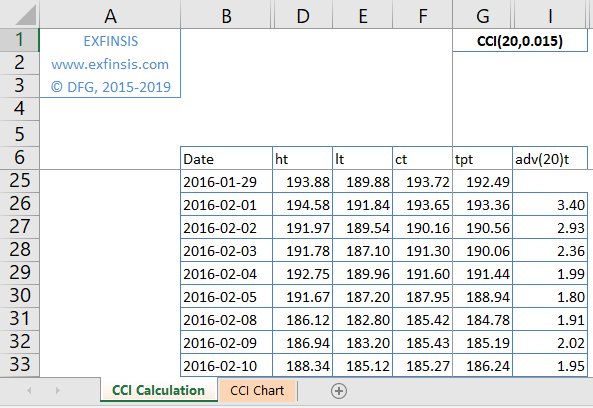
2.5. Typical prices mean absolute deviation or average deviation calculation.
- Data: S&P 500® index replicating ETF (ticker symbol: SPY) daily high, low, close prices (2016).
- Typical prices mean absolute deviation or average deviation number of periods not fixed and only included for educational purposes.
2.6. Typical prices mean absolute deviation or average deviation calculation formulas.
2.7. CCI stock technical indicator calculation.
- Data: S&P 500® index replicating ETF (ticker symbol: SPY) daily high, low, close prices (2016).
- Commodity channel index CCI stock technical indicator number of periods and constant factor not fixed and only included for educational purposes.
2.8. CCI stock technical indicator calculation formulas.
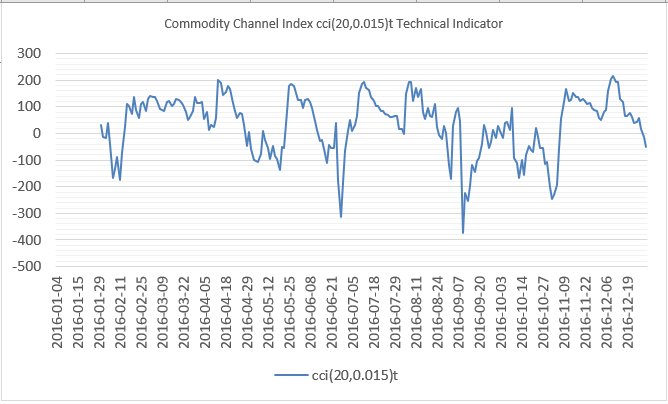
2.9. CCI stock technical indicator chart.
3. References.
[1] Donald R. Lambert. “Commodity Channel Index: Tool for Trading Cyclic Trends”. Commodities Magazine (now Futures Magazine). 1980.